
Microsoft Fabric in IoT Application
How does it support their work in small manufacturing companies?
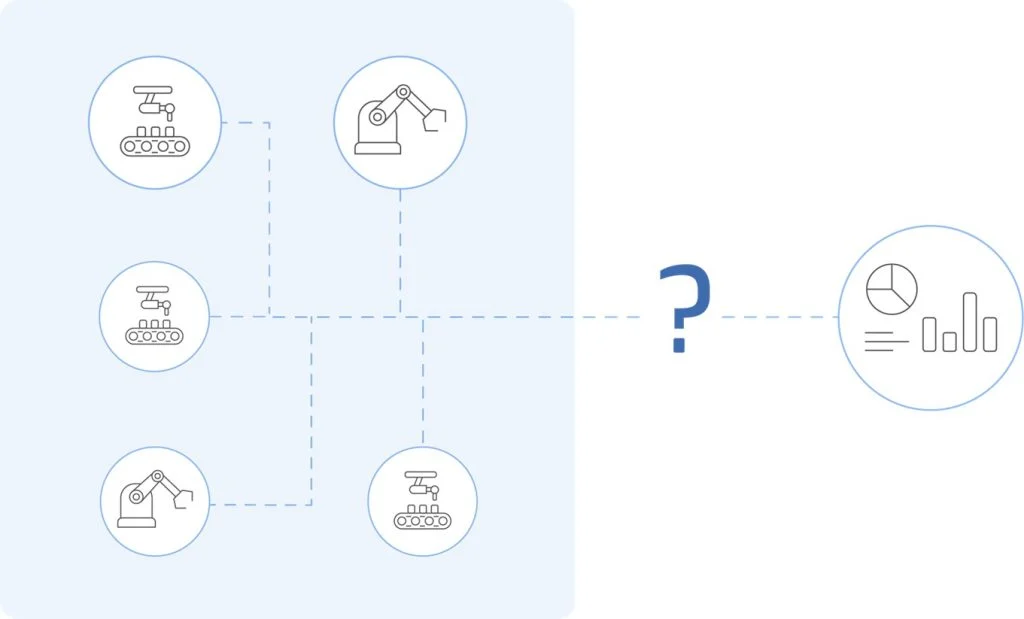
The challenge arises when this data needs to be properly collected, integrated, transformed, analyzed, and delivered in an appropriate format to production staff, managers, or the maintenance department. Popular systems such as ERP or MES may struggle with the sheer volume of IoT data, its variability, and frequency. At this stage, Microsoft Fabric comes into play — a comprehensive cloud analytics platform that combines analytical capabilities, AI, and reporting within a single environment.
This article sheds light on how small manufacturing companies can leverage Microsoft Fabric to handle IoT sensor data and examines the benefits that this approach can bring.
MS Fabric is an integrated analytics platform that combines features known from Azure Data Factory, Power BI, Data Lake, and Machine Learning within a single environment. It enables connection to multiple data sources for collection and storage in a scalable OneLake repository, and supports advanced data transformations, as well as analysis and visualization in Power BI.
For small manufacturing companies, three features are particularly important:
The foundation of any IoT system is effective data acquisition. Integration of MS Fabric with Azure IoT Hub and Event Hubs allows data to be received directly from machines equipped with sensors. It is also possible to use Fabric’s native feature for stream processing — Eventstream. This component is responsible for stream processing, receiving data in real time and enabling transformations during transmission. The data is then directed straight to a KQL database or OneLake.
Example 1: Energy Consumption Monitoring
A company producing metal components installs sensors on its presses to measure electricity consumption. Every few seconds, sensor data is sent to Azure IoT Hub and then forwarded to Microsoft Fabric, where it can be stored in OneLake and analyzed in real time.
Outcome: The maintenance department has access to continuously updated Power BI reports that show which machines are consuming the most energy at any given moment, allowing for better scheduling and cost minimization.
Example 2: Quality Control Using Vibration Sensors
A factory producing plastic toys installs vibration sensors on its injection molding machines. The data is sent directly to Fabric, where built-in analytical tools detect deviations from the norm.
Outcome: Rapid detection of unusual vibrations allows for immediate intervention, preventing the production of defective products.
Example 3: Water Usage Monitoring
A beverage bottling factory installs sensors to measure water flow and usage. In the final Power BI reports, sensor data is combined with the number of beverages produced.
Outcome: The comparison in Power BI shows how much water the factory loses during production processes, providing insight into where water is being used inefficiently or wasted.
Collecting data is just the beginning. The real value lies in the ability to process it in real time, allowing for immediate response to changes in production processes. Fabric offers several options for data processing:
Structured Streaming
Create custom pipelines using Spark Notebooks. This approach offers greater flexibility and support for more advanced transformations compared to Eventstream. Use it when you need to apply more complex logic to streaming data.
Eventstream
When used for data ingestion, take advantage of its full functionality and transform data in transit. Eventstream enables a wide range of operations such as aggregations, filtering, calculations, and adding new columns.
Example 4: Predictive Maintenance
A company producing rubber components uses temperature and humidity sensors in the production hall. In Fabric, the data is processed in real time, and machine learning models predict when environmental conditions may lead to mold damage.
Outcome: Employees are alerted before failures occur, reducing downtime and repair costs.
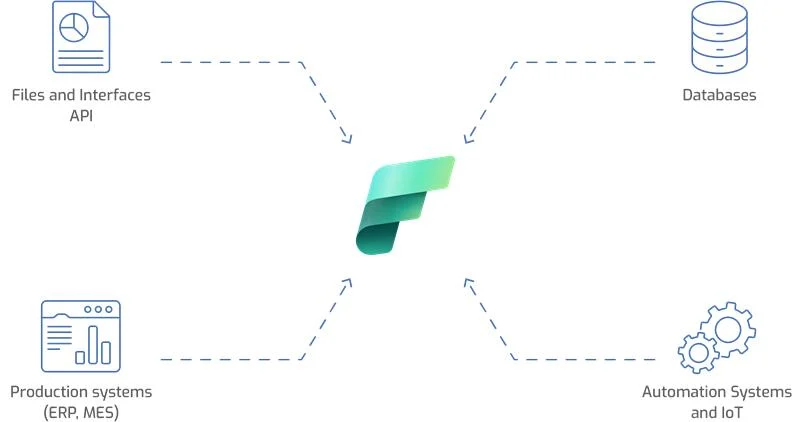
Often, IoT sensor data alone does not provide a complete picture of the situation. It is crucial to combine it with other sources, such as data from ERP systems (orders, production) or MES systems (machine scheduling).
Microsoft Fabric enables easy integration of data from various systems and the creation of unified analytical models.
Example 5: Production Schedule Optimization
A small factory producing hinges combines IoT sensor data on machine downtime and operating hours with information extracted from the factory’s ERP system. This allows Power BI reports to show how equipment failures affect order fulfillment deadlines.
Outcome: The production manager can plan shifts more effectively and respond flexibly to delays.
Even the best data analysis has little value if the target audience cannot understand its message. Fabric integrates directly with Power BI, enabling the creation of interactive reports and dashboards accessible on both desktops and mobile devices. Data analysis can take place on two levels:
KQL Database
A database based on Kusto Query Language, it can receive data directly from Eventstream. Ideal for fast analysis of IoT streams, logs, or telemetry. Write KQL queries to quickly extract the data that matters to you.
Real-Time Dashboard
Power BI visualizations based on streaming data (directly from Eventstream or KQL). This functionality enables analysis of reports with freshly captured data from the production floor.
Data Activator
A Fabric tool designed to provide real-time notifications about ongoing situations. Create rules on streaming data to be immediately informed of critical events in production processes, such as exceeding allowable temperatures, pressure drops, and more. Alerts can be sent via Teams, email, SMS, or displayed directly in Power BI reports.
Example 6: Real-Time Production Board
In a furniture manufacturing company, a screen is installed on the production floor displaying a Power BI dashboard powered by Microsoft Fabric. The board shows the current status of machines, OEE (Overall Equipment Effectiveness) metrics, and alerts for exceeding allowable operating parameters.
Outcome: Production staff can see in real time what is happening on the lines and respond immediately to any issues.
Microsoft Fabric is a tool that opens new possibilities for small manufacturing companies seeking to make effective use of IoT sensor data. The integrated platform enables data collection, transformation, and analysis within a single environment. Companies can respond more quickly to changes in production processes, reducing the risk of failures and improving production efficiency.
Importantly, implementing Fabric does not require extensive infrastructure or large financial investments — it is cloud-based and scales with the company’s needs. This makes technology that was once the domain of large corporations accessible to smaller factories, allowing them to fully leverage the potential of IoT data.
Contact Us!
Select your preferred date and time for contact.
