

Power BI
Case Study

Client Introduction:
A global FMCG company focused on healthy nutrition, sustainability, and innovation in the food industry. One of the largest plant-based consumer packaged goods company in the world. It has production facilities across five continents.
Client Challenge:
To implement a system that monitors key production indicators (including OEE) across 13 factories on 5 continents, and to integrate operator-declared data with telemetry data from machines and sensors.
Implementation Results:
Our client, a global company and a leader in the manufacturing of spreads and plant-based foods needed our help with their OEE analysis. Antdata’s task was to implement a comprehensive Business Intelligence tool that would allow them to calculate and analyse the OEE (Overall Equipment Effectiveness) indicator, which is a percentage snapshot of machinery usage efficiency. The challenge was (as it is in many cases) that the data came from 15 factories around the world whose reporting systems were inconsistent.
Our interactive report thanks to the integration of different systems in Power Query, showed standardize indicators, which had a direct impact on the quality of the data and the repeatability of analysis. The implementation of the Power BI solution provided a clear, up-to-date, and easily accessible view of the effectiveness of individual lines in the factories, including downtime. This helped to focus on what needed to be improved to deliver value to the business. As a result, their performance got better from the bottom up – both globally and from a single production line perspective.
But it doesn’t stop there. Thanks to the use of Power BI reporting it is possible to monitor the trend of availability, productivity, and quality over time. This allows for faster and more accurate identification of areas and processes with high potential for improvement to plan optimization activities in the places which require it most.
Looking at the standardized OEE indicators, it is possible to perform comparative analysis and detect differences in efficiency between individual production lines or entire factories, as well as to detect anomalies that can determine the speed and quality of production.

Client Introduction:
A global consulting firm specializing in risk management, restructuring, finance, and strategic communication.
It supports clients in solving complex business, legal, and regulatory challenges by providing expert analyses and strategic advice.
Client Challenge:
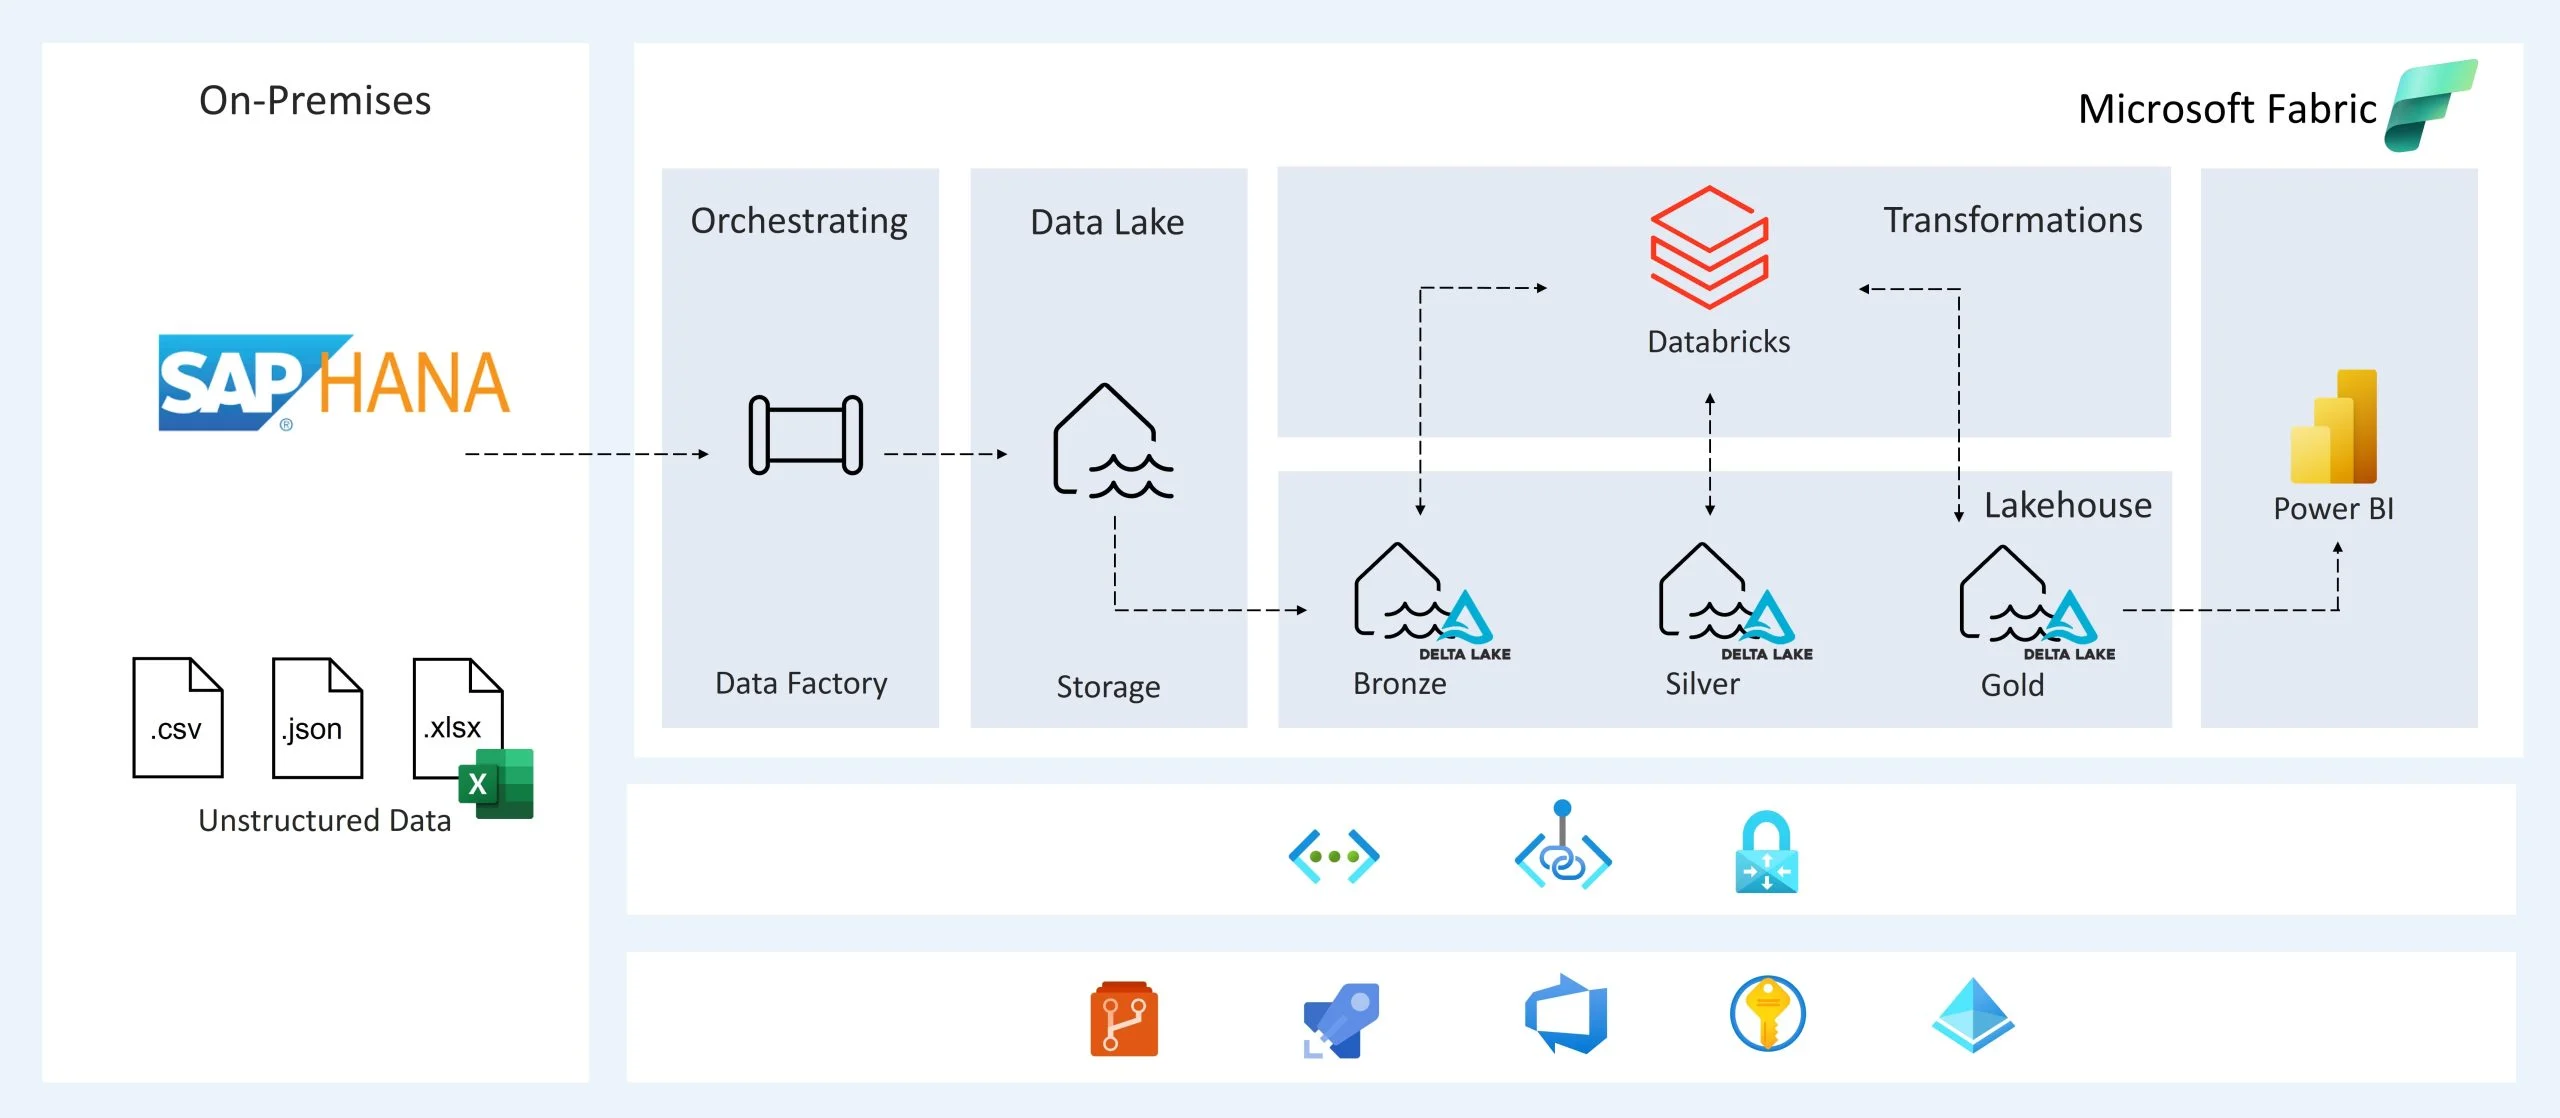
The data warehouse based on SQL Server (on-premise) lacked sufficient performance for frequent refreshes in Power BI (due to the size of the data model, with refresh times of around 2-3 hours). The client’s goal was to speed up the report refresh time and increase the frequency of updates.
Implementation Results:
Our client, a global consulting firm specializing in risk management, restructuring, finance, and strategic communication, relies on advanced analytics to support complex business and regulatory challenges.
The key issue was the performance of their on-premise SQL Server data warehouse. Due to the size of the data model, Power BI refreshes took 2–3 hours, limiting update frequency and delaying insights. The goal was to significantly reduce refresh time and improve reliability.
We redesigned and optimized the architecture, migrating around 150 tables and streamlining data processing. The solution covered nearly 30 report pages with Row-Level Security (RLS) and integrated key sources such as Unit4, TM1, the data quality monitoring system, and Dai.
As a result, refresh time dropped to below 0.05 hours (under 3 minutes), and refresh errors were eliminated. The client can now access up-to-date data faster, enabling quicker and more reliable decision-making.

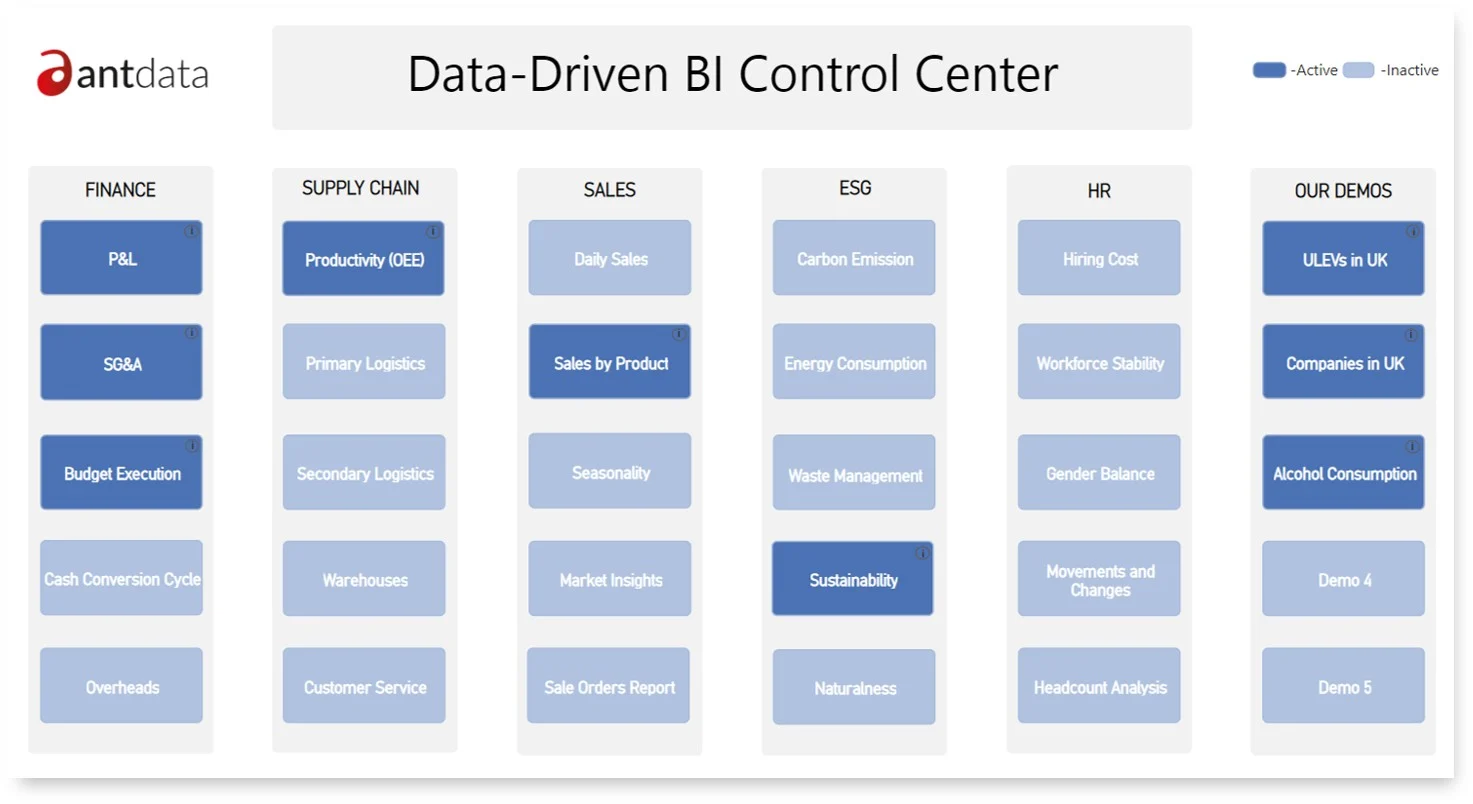
A large multinational company, wanted to implement an end-to-end reporting solution to gain a comprehensive and unified view of their business. The goal was to align reporting across key pillars such as Finance, Supply Chain, Sales, ESG, and others, while tailoring specific reports and KPIs to support strategic business objectives.
The challenge was the diversity and complexity of data sources. Information came from multiple internal systems, including ERP and MES platforms, spreadsheets, and data from various locations, including production and sales units. Ensuring consistency, accuracy, and accessibility across these sources was critical.
Our solution involved building a centralized data repository – a single source of truth- with secure access for different departments. On top of this, we implemented a central navigation dashboard, providing an intuitive, interactive view of performance across the organization. This enabled teams to monitor KPIs, identify trends, and make informed decisions with confidence.
By integrating multiple data sources and standardizing reporting, the client gained a unified, transparent, and actionable overview of their operations. This not only improved data reliability but also empowered faster, more strategic decision-making across the company.
Book a consultation call and we will get back to you.
Select a date for a consultation phone call.

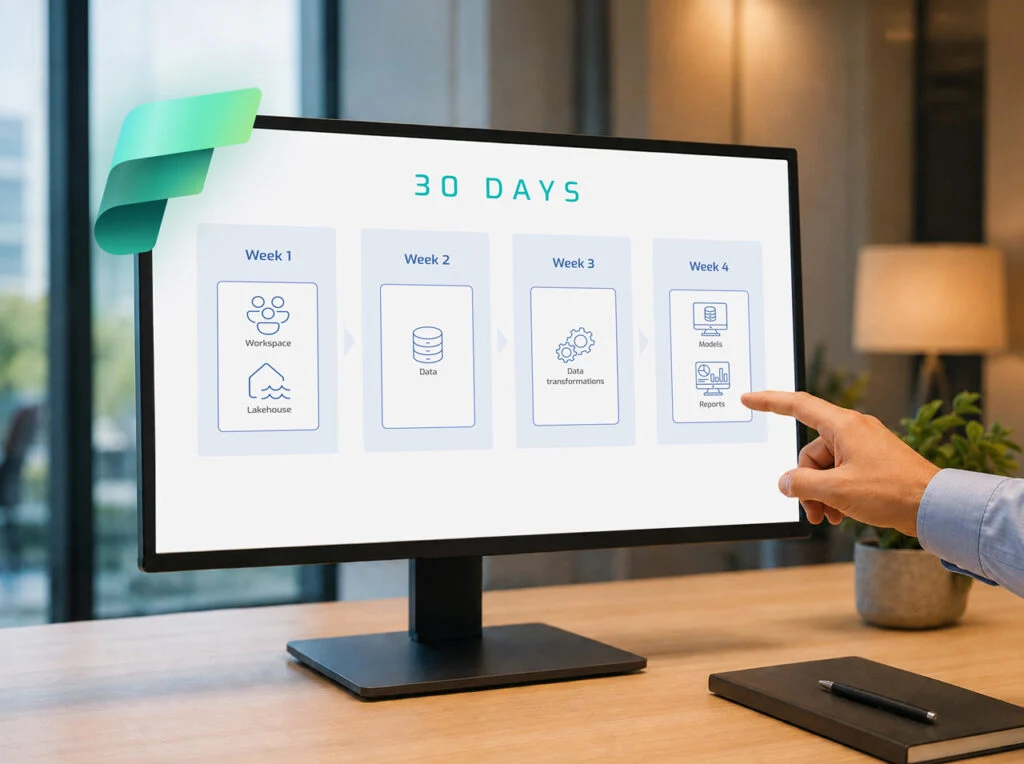
How to get started with Microsoft Fabric, organize your data, and build your first working flow from a data source…
Read more
Data is now one of the most important assets in any organization. Its quality, availability and practical use affect not…
Read more
OneLake Fabric - a unified data layer
Read more