
Case Study 1: AI-Powered Sales Forecasting
Client Introduction:
A European manufacturer of household plastic products, active in the market for several decades, offering a wide range of items – from food containers and kitchen accessories to organizers, bins, and children’s products.
Client Challenge:
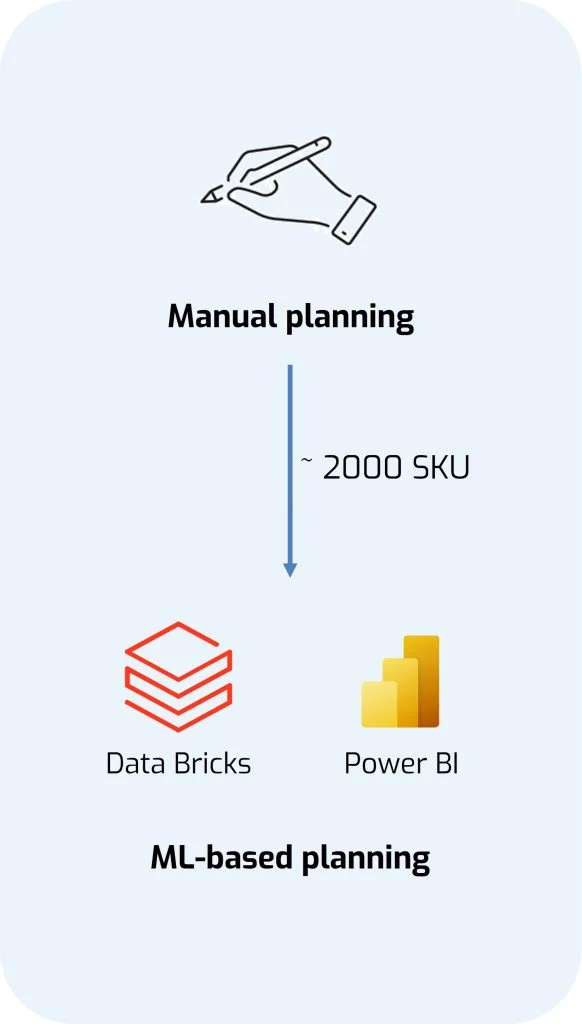
The company faced challenges with manually planning sales volumes and sought to improve forecast accuracy through demand sensing, enabling more responsive and data-driven inventory and production planning.
Main data sources:
Forecasts generated for:
Forecasting at the level of:
Implementation Results:
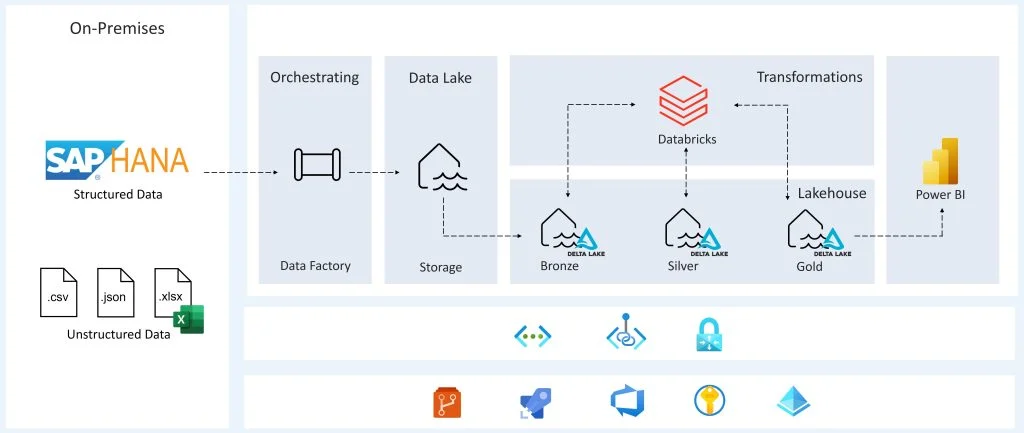
The solution was built on a modern Azure Lakehouse architecture, integrating on-premises SAP data (approx. 2,000 SKUs) and external data sources into a unified, scalable cloud environment. Data ingestion and orchestration are fully automated using Azure Data Factory, with structured storage in Azure Data Lake Storage following a layered Bronze / Silver / Gold Delta Lake approach. The Bronze layer captures raw ERP and external data, the Silver layer ensures data cleansing, transformation, and integration, and the Gold layer provides a curated analytics-ready dataset optimized for AI-driven sales forecasting and business intelligence.
Machine learning models are developed and deployed in Azure Databricks, generating short-term demand forecasting outputs for 1–5 weeks ahead at multiple aggregation levels (SKU, SKU by factory, and product groups). Forecast results are delivered through interactive Power BI dashboards, enabling data-driven sales planning, production planning, and inventory optimization.
This cloud-based data platform ensures high scalability, automated data pipelines, strong data governance, and modular extensibility. By combining Microsoft Azure, Databricks, Delta Lake, and Power BI, the architecture provides a robust foundation for advanced analytics, AI-powered demand sensing, and continuous improvement of forecast accuracy across the organization.
Case Study 2: Copilot Implementation

Client Introduction:
A global FMCG corporation operating multiple brands and production facilities across different regions worldwide, leveraging Power BI as its core enterprise reporting platform.
Client Challenge:
The organization needed to provide decision-makers with faster and more intuitive access to data, along with the ability to shape and analyze it dynamically.
Key challenges included:
Implementation Results:
The integration of a Power BI – Data Model with an AI agent such as Microsoft Copilot within Power BI enables true real-time conversational analytics.
In this architecture, the AI Agent translates natural language questions into optimized DAX and SQL queries, interacting directly with the semantic data model. By automatically generating measures, calculations, and queries, it removes the need for manual coding while preserving analytical precision and performance.
The result is immediate access to KPIs, forecasting insights, and performance metrics through conversational interaction. This combination of LLM capabilities, automated DAX and SQL generation, and enterprise BI infrastructure delivers measurable analytical value – transforming traditional dashboards into intelligent, real-time decision support systems.

OEE Analytics & Power BI Reporting

Client Introduction:
A global FMCG company focused on plant-based consumer packaged foods, with 13 factories and ~120 production lines worldwide. The company aimed to standardize OEE monitoring across its global operations.
Client Challenge:
Solution
- Integration of multiple data sources (IoT terminals, machine telemetry, SAP, operator input) using Power Query.
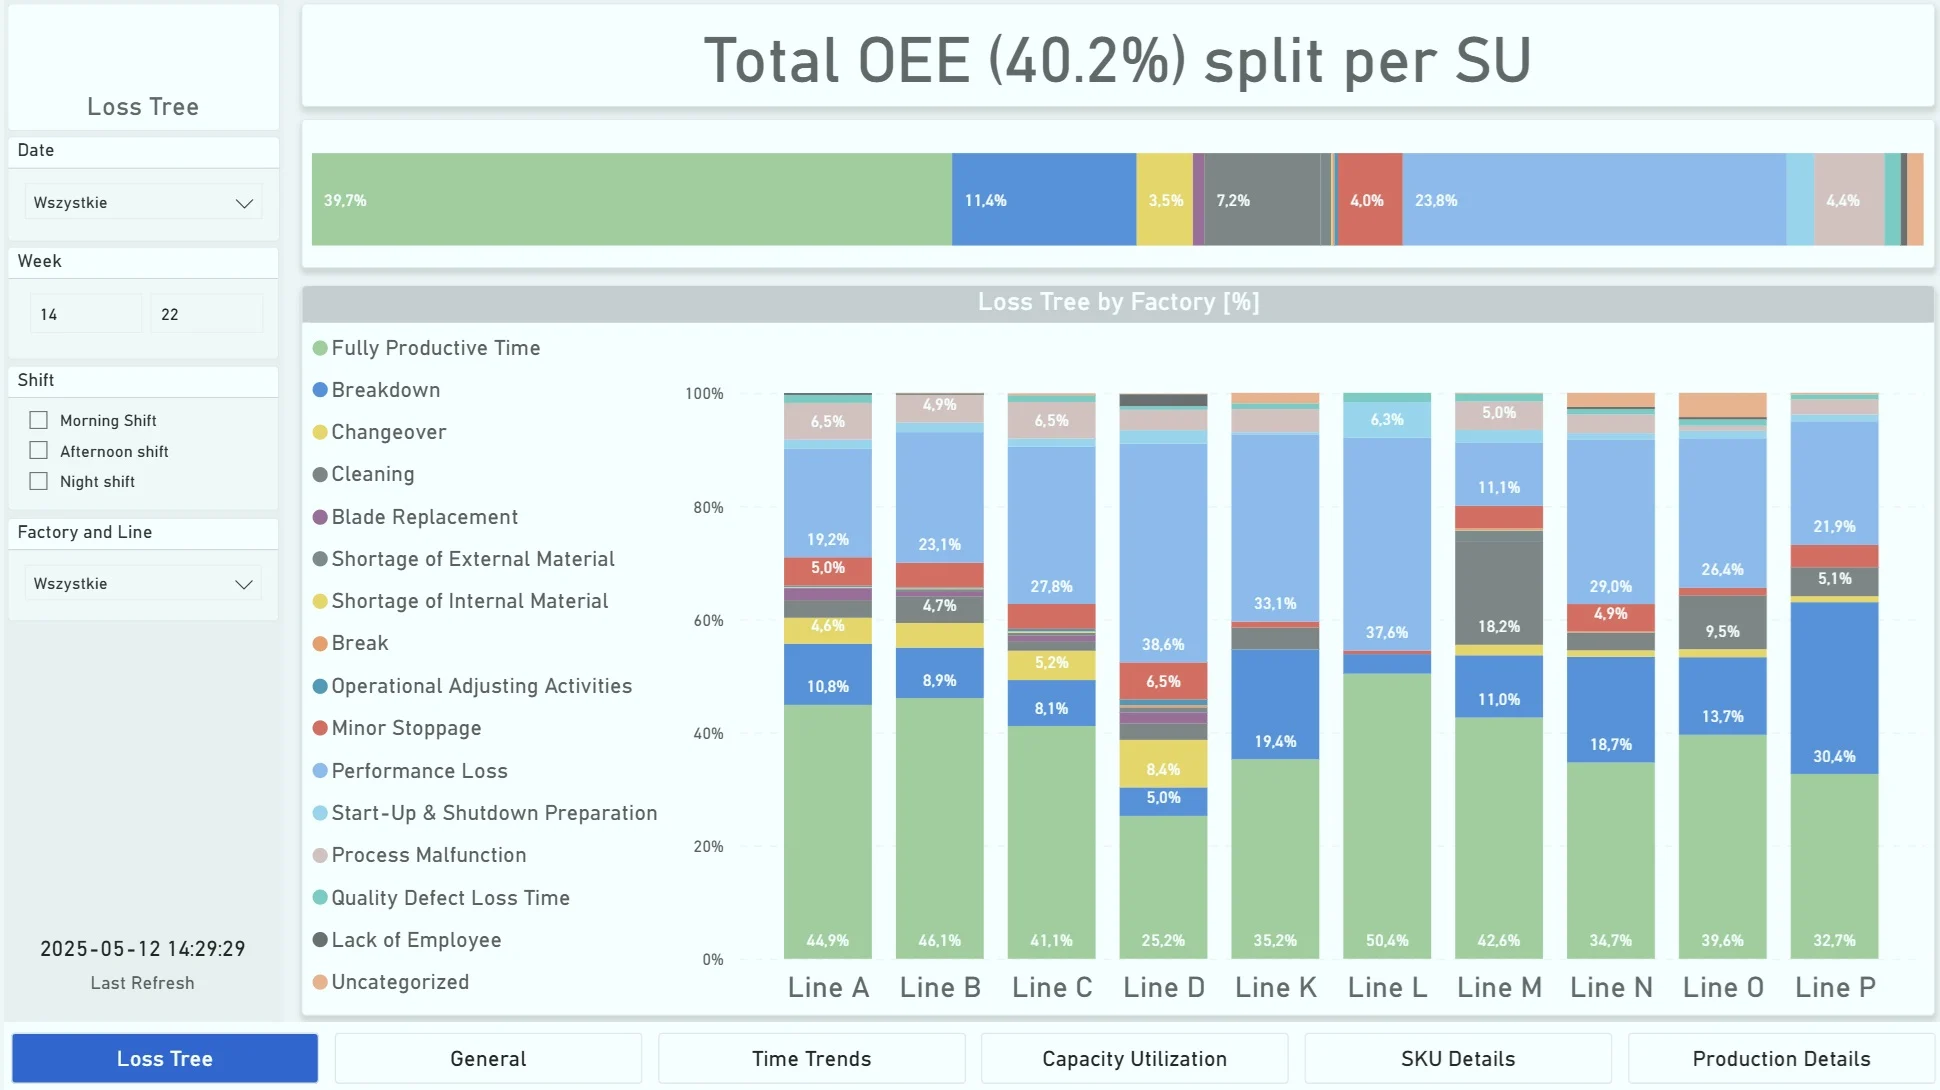
- Development of interactive, live Power BI dashboards, accessible via Power Apps, providing real-time and historical OEE metrics.
- Standardization of KPIs, enabling consistent comparisons across lines and factories.
- Dashboards allowed tracking of availability, performance, quality, and downtime trends.
Implementation Results:
- ~500 daily active users, including plant managers and production planners.
- Standardized OEE metrics across all factories.
- Faster identification of inefficiencies and prioritization of optimization efforts.
- Comparative analysis between lines and factories, plus anomaly detection.
Business Impact:
- Improved production efficiency across all lines.
- Enhanced decision-making with data-driven insights.
- Accelerated optimization initiatives where they were most needed.
PLC Integration & Digital Twin for Manufacturing
Client Introduction:
A global FMCG manufacturer with production facilities across 13 factories on 5 continents, operating approximately 120 production lines. The client needed real-time visibility into machine states, performance parameters, and process conditions to optimize operations and support global production management.
Client Challenge:
Solution
- Integration of PLC controllers, IoT terminals, machine telemetry, and SAP data into a unified, scalable data pipeline.
- Creation of a Digital Twin representing the manufacturing environment, reflecting real-time machine states and production processes.
- Development of interactive dashboards and reports accessible through Power Apps, combining live and historical data.
- Machine Learning models deployed for anomaly detection and predictive maintenance, enabling proactive interventions before downtime occurs.
Implementation Results:
- Real-time monitoring across ~120 production lines.
- Daily active users: ~500 including plant managers and production planners.
- Access to a suite of live and historical reports for tracking performance, availability, quality, and downtime trends.
- Standardized, actionable production metrics across 13 factories.
- Significant increase in production efficiency and faster identification of bottlenecks.
Business Impact:
- Improved operational visibility across global production lines.
- Reduced unplanned downtime and optimized maintenance schedules.
- Enabled proactive, data-driven decision-making, laying the foundation for future AI-driven analytics and OEE optimization initiatives.

Get in touch with us
Book a consultation call and we will get back to you.
Select a date for a consultation phone call.